Ctrl+K
vizent 1.1.2 documentation - Home
  • Home
  • Getting Started
  • User Guide
  • Gallery
  • Reference
  • GitHub
  • Twitter
  • Home
  • Getting Started
  • User Guide
  • Gallery
  • Reference
  • GitHub
  • Twitter

Section Navigation

  • Scatterplot
  • Cartopy Map
  • Background Image Map
  • Vizent Glyphs with Matplotlib Elements
  • Projected Cartopy Map
  • Network example
  • Mapbox route example
  • Glyphs and edges of the London Underground
  • Bus flow on road networks in Central London
  • Gallery

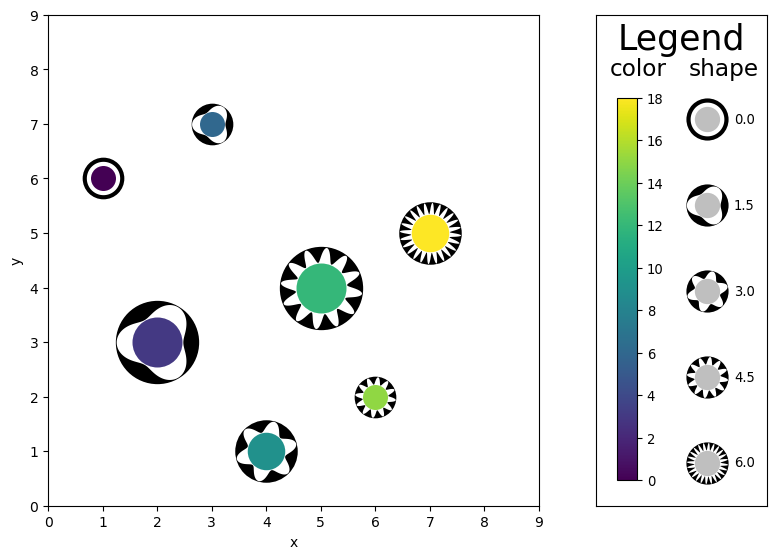
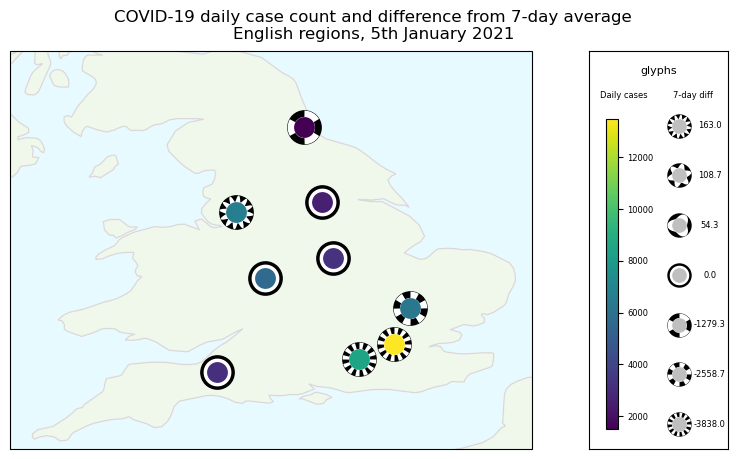
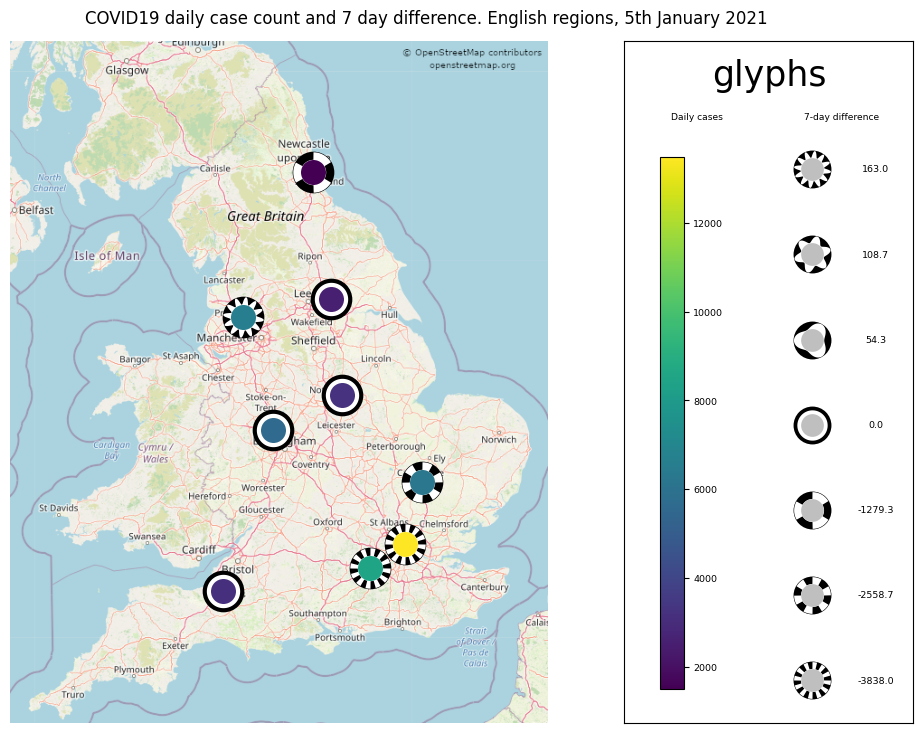
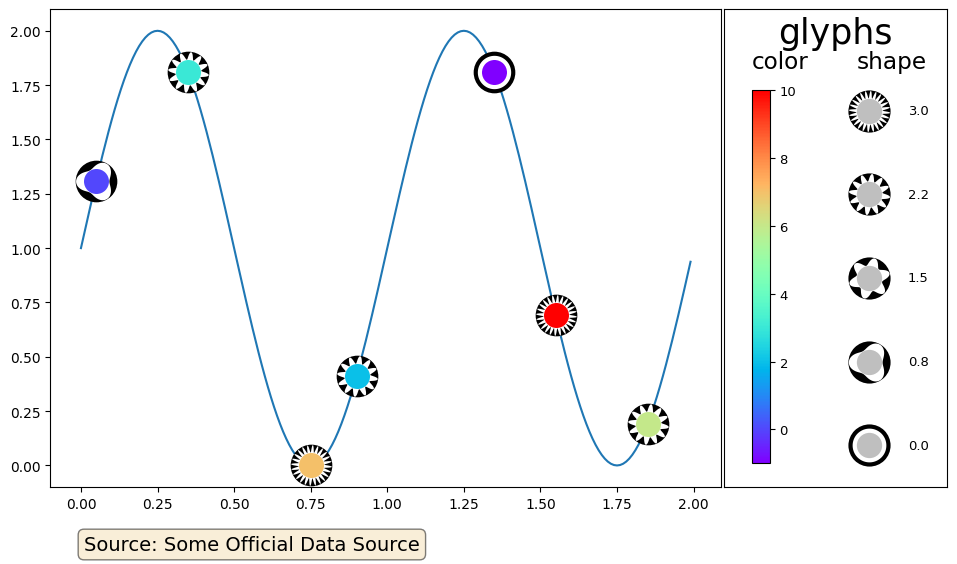
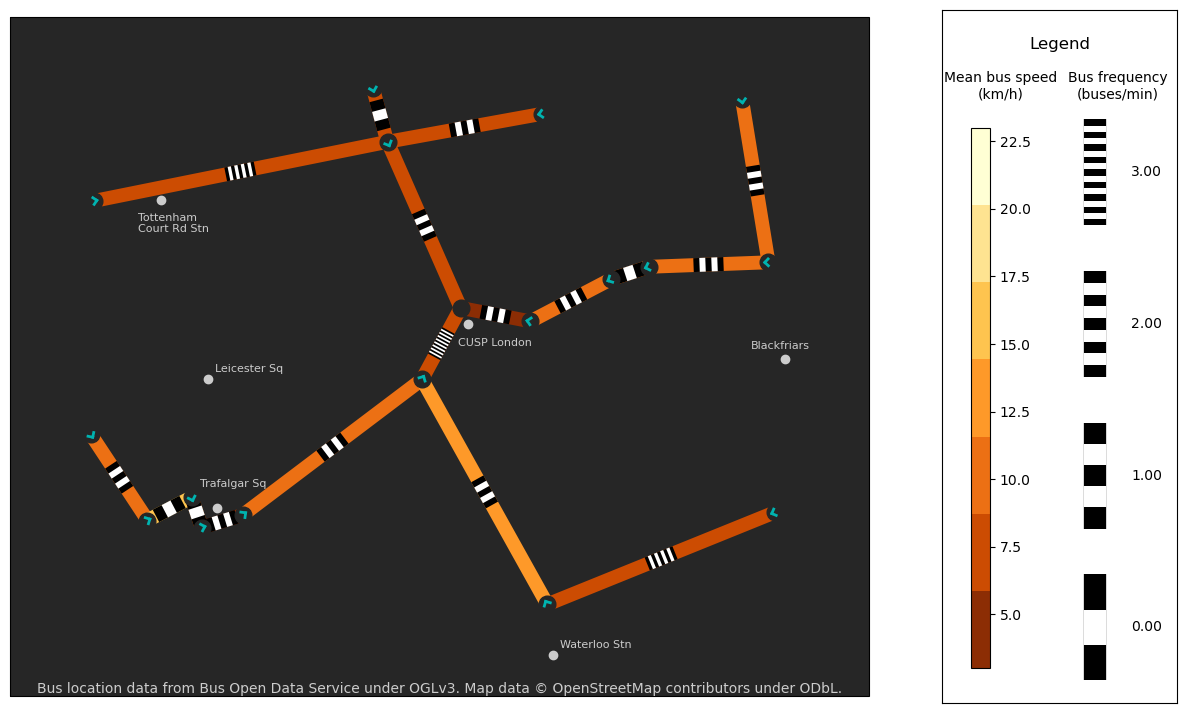
Gallery#

Scatterplot
Cartopy Map
Background Image Map
Vizent Glyphs with Matplotlib Elements
Projected Cartopy Map
Network example
Mapbox route example
Glyphs and edges of the London Underground
Bus flow on road networks in Central London
Show Source

© Copyright 2023, CUSP London, Lucy McLaughlin.

Created using Sphinx 7.1.2.

Built with the PyData Sphinx Theme 0.14.4.