Basic Scatterplot#
[6]:
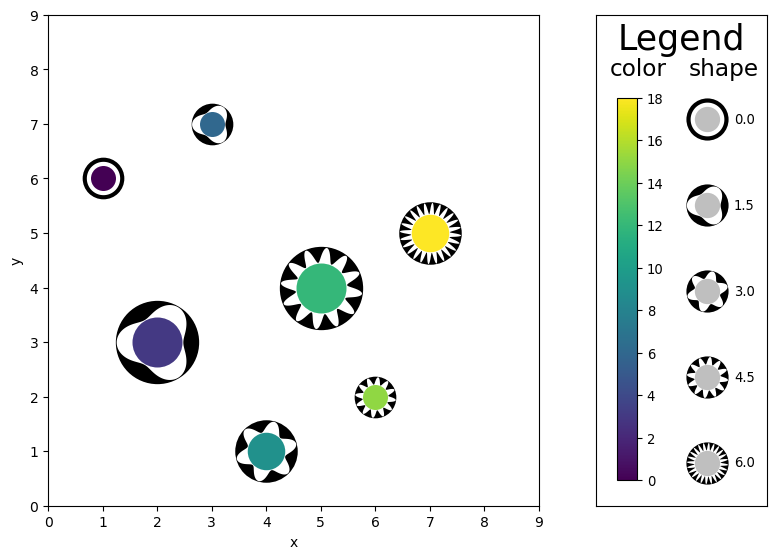
from vizent import vizent_plot

x_values = [1,2,3,4,5,6,7]
y_values = [6,3,7,1,4,2,5]
color_values = [0,3,6,9,12,15,18]
shape_values= [0,1,2,3,4,5,6]
size_values = [30,60,30,45,60,30,45]

extent = [0, 9, 0, 9]

fig = vizent_plot(x_values, y_values, color_values, shape_values, size_values,
                  color_label="color", shape_label="shape", glyph_legend_title='Legend',
                  extent=extent)

fig.axes[1].set_xlabel('x')
fig.axes[1].set_ylabel('y')
[6]:
Text(0, 0.5, 'y')