User Guide#
The Vizent library provides an interface for the plotting of bivariate data on points and edges.
For points, the bivariate data is displayed via a set of glyphs that encode two channels of information via a central colored point, whose colors vary according to a primary quantity, and by a surrounding shape with varying frequencies as determined by a secondary quantity. Different shapes are available (see section on Glyph Designs below) that can encode a diverging scale.
For edges, a coloured line provides the primary channel for displaying information, with a secondary channel given by a line segment with alternating black and white stripes. The frequency of these stripes encode the data provided.
Create a vizent plot#
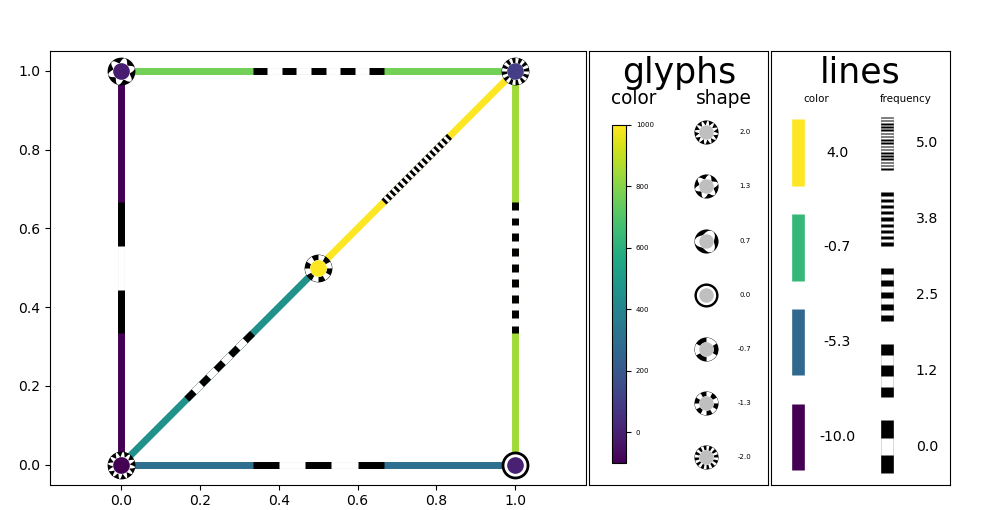
The vizent_plot() function provides a convenient wrapper to produce vizent plots. A simple example is provided below.
x_values = [0, 0, 1, 1, 0.5]
y_values = [0, 1, 0, 1, 0.5]

color_values = [-100, -10, 0.01, 100, 1000]
shape_values = [2, 1, 0, -2, -1]

edge_color_values = [-10, -5, -3, 1, 2, 4]
edge_freq_values = range(6)
color_values = [-100, -10, 0.01, 100, 1000]
shape_values = [2, 1, 0, -2, -1]

# Build a sample network based on these points
x_start = []
x_end = []
y_start = []
y_end = []
for x1,y1 in zip(self.x_values, self.y_values):
    for x2,y2 in zip(self.x_values, self.y_values):
        if x1 <= x2 and y1 <= y2:
            line_distance =  np.sqrt((x1 - x2)**2 + (y1 - y2)**2)
            if line_distance <= 1 and line_distance > 10e-5:
                x_start.append(x1)
                y_start.append(y1)
                x_end.append(x2)
                y_end.append(y2)

fig = vizent_plot(x_values=x_values,
                  y_values=y_values,
                  colour_values=color_values,
                  shape_values=shape_values,
                  size_values=[20 for i in range(len(self.x_values))],
                  edge_start_points=[(x,y) for x,y in zip(x_start, y_start)],
                  edge_end_points=[(x,y) for x,y in zip(x_end, y_end)],
                  edge_colors=edge_color_values,
                  edge_frequencies=edge_freq_values,
                  edge_widths=[5 for i in range(len(x_start))],
                  edge_color_n=4,
                  scale_x=15)
Using the vizent pipeline#
Finer-grained control is possible by using the vizent pipeline, comprising of a sequence of four function calls, described below.
create_plot(): Prepare the plotting area with spacing for required legends and possible background images.add_glyphs(): Add vizent glyphs to the plot, with added options for the appearance of the points and legend.add_lines(): Add vizent lines to the plot, with added options for the appearance of the points and legend.return_figure(): Provides a convenience function for handling the resulting image.
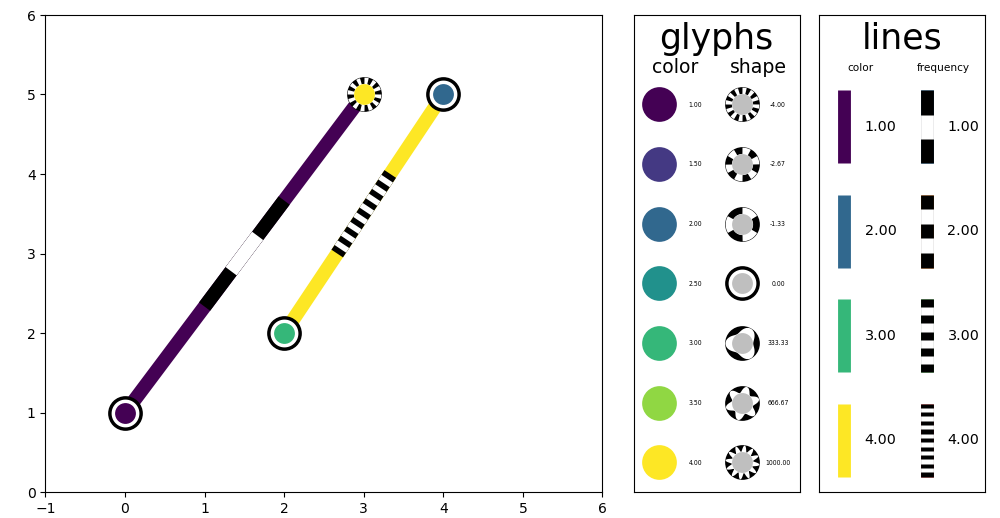
An example of this pipeline is given below:
# First the plot area is prepared. This includes specifications
# relating to the axes, plot area background and legends.

axes=create_plot(use_image=True, image_file="image.jpg",
                 extent=[0,6,0,6])

# Next any glyphs and lines are added. This can be done in any
# order, glyphs will always be placed on top of lines.

x_values = [1,4,2,3]
y_values = [1,5,2,5]
color_values = [1,2,3,4]
shape_values = [1,2,3,4]
size_values = [30,30,30,30]

add_glyphs(axes, x_values, y_values, color_values, shape_values,
           size_values)

x_starts = [2,1]
y_starts = [2,1]
x_ends = [4,3]
y_ends = [5,5]
color_values = [4,1]
shape_values = [4,1]
width_values = [15,15]

add_lines(axes, x_starts, y_starts, x_ends, y_ends, color_values,
          shape_values, width_values)

# Finally, the created figure is returned in the required manner.

return_figure(axes, "display")
Glyph Designs#
The available glyph shape designs are shown here in full. Value increases with frequency from left (lowest) to right (highest).
sine#

saw#

reverse saw#

square#

triangular#

concave#

star#

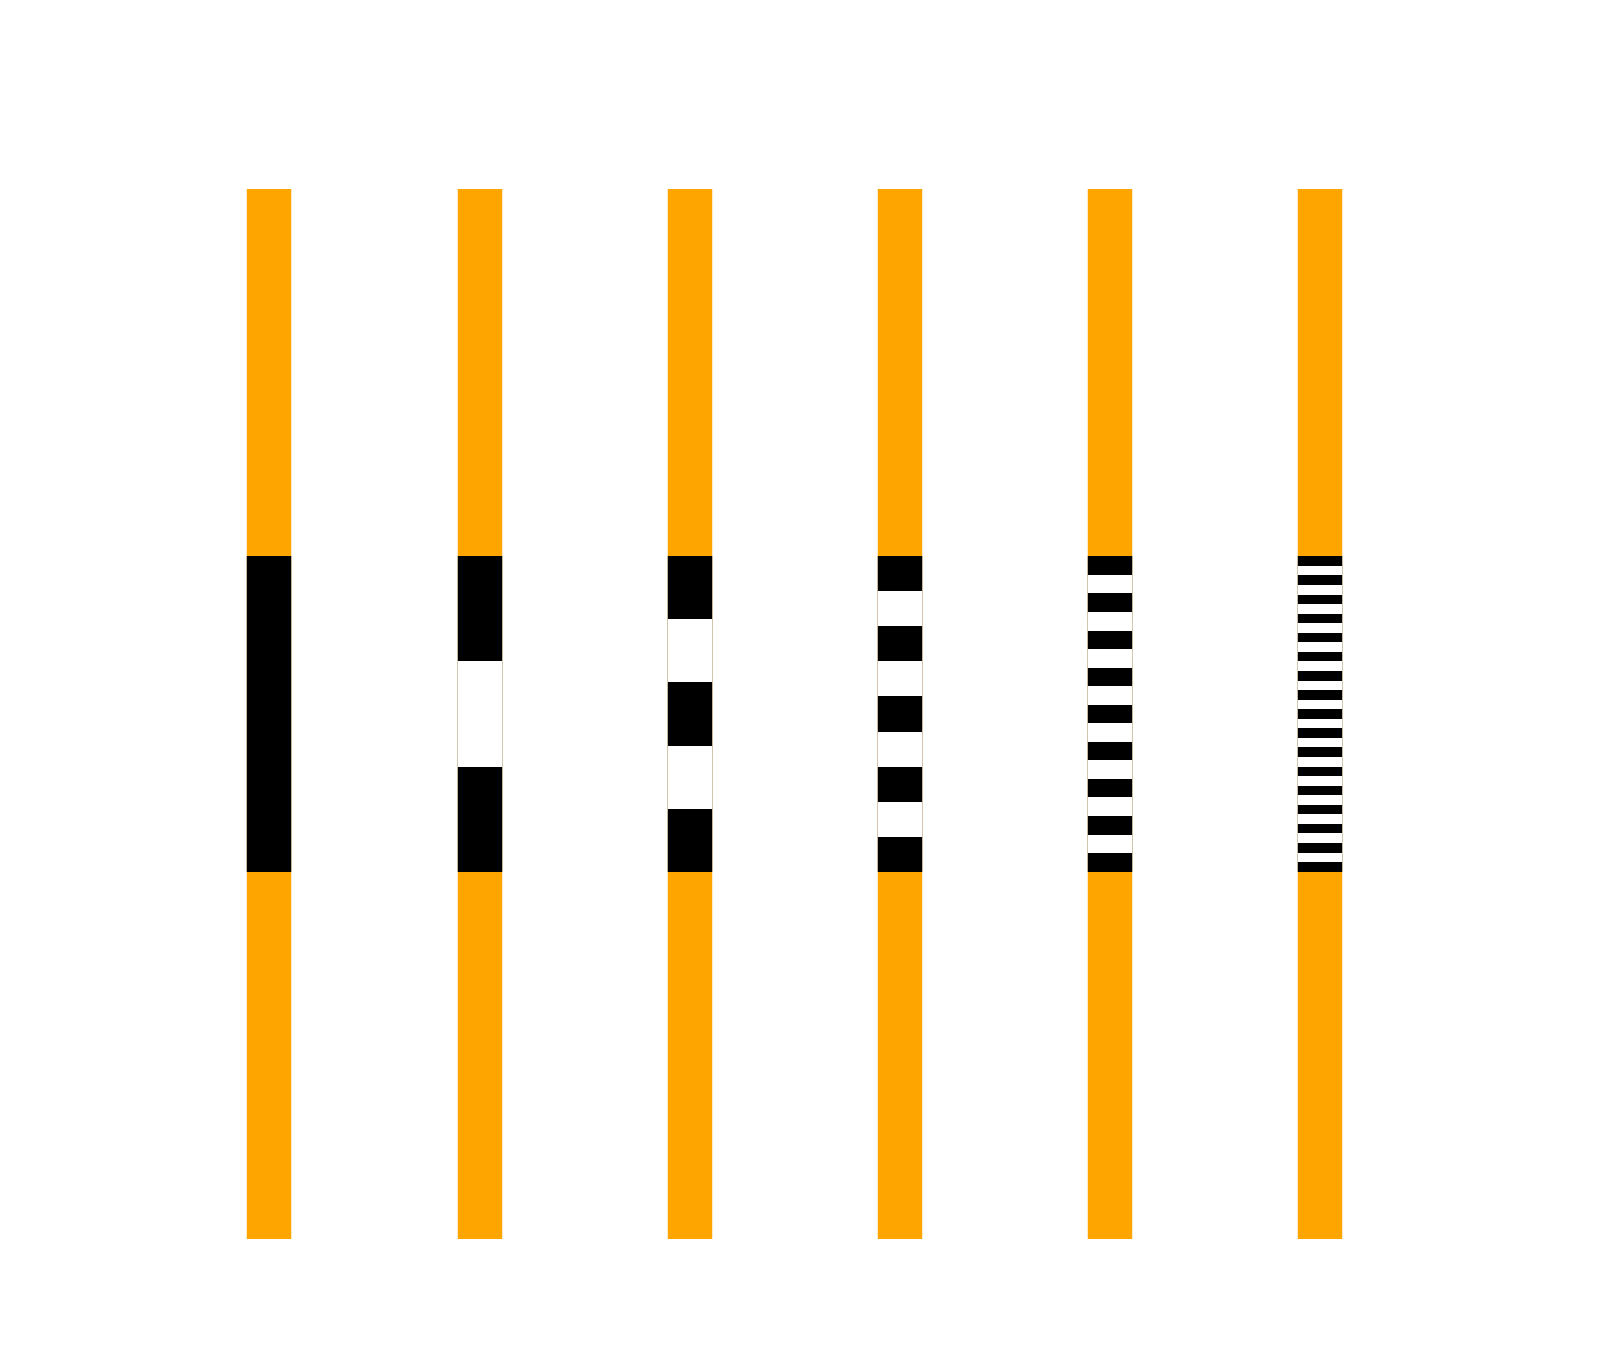
Line Samples#
Default sample lines for a variety of frequency values are shown below. The left-most line is used when the data contains numpy.nan (i.e. for missing data).