import pandas as pd
from vizent import vizent_plot
import matplotlib.text as text
import matplotlib.pyplot as plt
import cartopy.crs as ccrs
import warnings
warnings.filterwarnings('ignore')
df = pd.read_csv('sample-data/temperatures.csv')
# Use cartopy projection to web mercator
crs = ccrs.epsg(3857)
projected_points = crs.transform_points(x=df['longitude'],
y=df['latitude'],
src_crs=4326)
x = projected_points[:, 0]
y = projected_points[:, 1]
fig = vizent_plot(x,
y,
df['temperature_2m_max'],
df['diff'],
[21] * df.shape[0],
use_cartopy=True,
cartopy_projection=crs,
extent=[-15, 30, 30, 60],
shape_max=10,
shape_min=-10,
shape_n=4,
interval_type='limit',
color_min=10,
color_max=50,
colormap='YlOrRd',
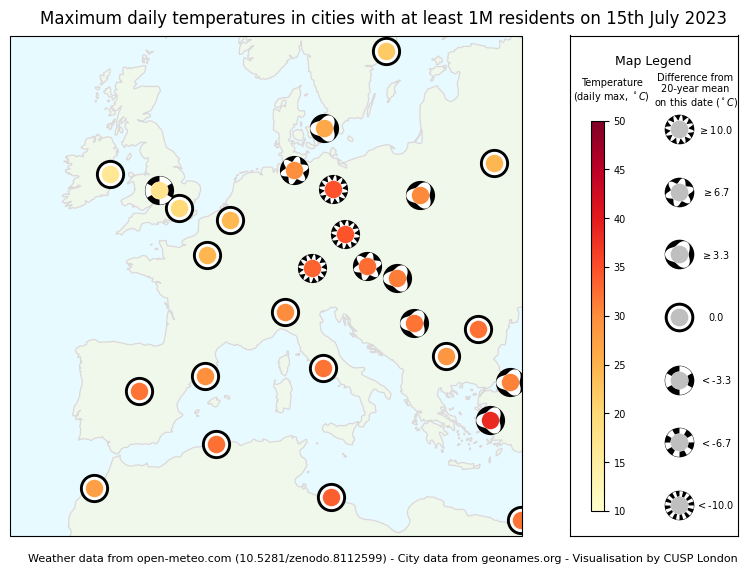
color_label='Temperature\n(daily max, $^\circ C$)',
shape_label='Difference from\n20-year mean\non this date ($^\circ C$)',
glyph_legend_title='Map Legend',
label_fontsize=7)
# Add inequalities to shape legend to emphasise limit/threshold approach to intervals.
for child in fig.axes[0].get_children():
if type(child)==text.Annotation:
if child.get_text()[0] == '-':
child.set_text('$<$' + child.get_text())
else:
try:
value = int(child.get_text()[0])
if value != 0:
child.set_text('$\geq$' + child.get_text())
except:
pass
fig.suptitle('Maximum daily temperatures in cities with at least 1M residents on 15th July 2023', y=0.92)
plt.text(x=0.145,
y=0.07,
s="Weather data from open-meteo.com (10.5281/zenodo.8112599) - City data from geonames.org - Visualisation by CUSP London",
transform=fig.transFigure,
fontsize=8)
fig.set_size_inches(10, 6.5)