from vizent import vizent_plot
import numpy as np
import matplotlib.pyplot as plt
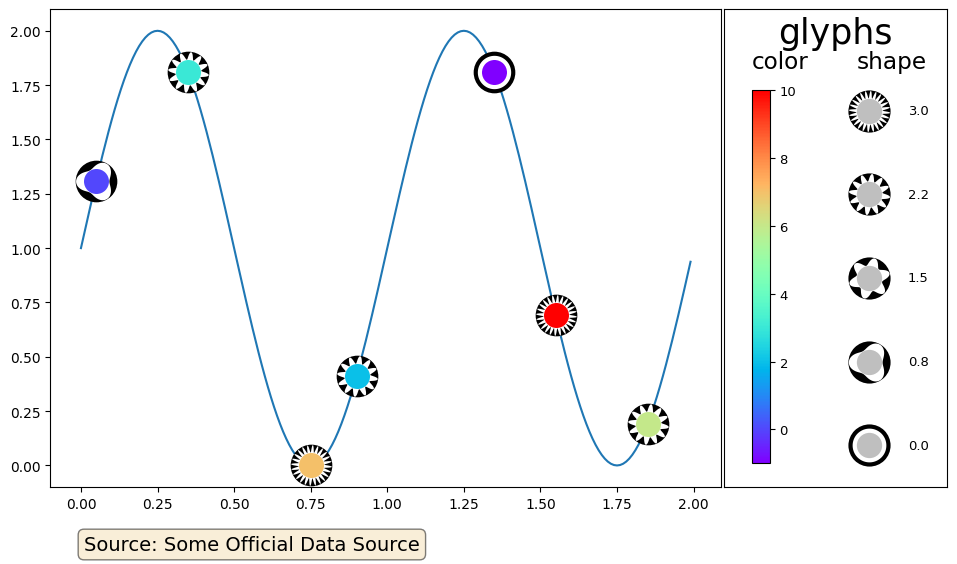
# Let's take an example of a vizent plot and add to it
x = [0.05,0.35,0.75,0.9,1.35,1.55,1.85]
y = [(1 + np.sin(2 * np.pi * i)) for i in x]
color_values = [0,3,7,2,-1,10,6]
shape_values = [1,2,3,2.3,0,3,2]
size = [30,30,30,30,30,30,30]
# Assign the output of the function to fig, ax as shown
fig = vizent_plot(x, y, color_values, shape_values, size,
colormap="rainbow", shape_label="shape",
color_label="color", return_axes=True,
title="An example of adding to your plot")
# Let's add a line to the plot
t = np.arange(0.0, 2.0, 0.01)
s = 1 + np.sin(2 * np.pi * t)
# Adjust zorder to control whether line is behind or in front of points,
# background image etc. In this case, zorder=0 places the line behind the
# points while zorder=1 would place it in front. If using a background
# image, zorder=0.5 places the line in front of the background image,
# but behind the points.
ax = fig.axes[1]
ax.plot(t, s, zorder=0)
# Let's also add a text box with some additional information, such as the
# data source
props = dict(boxstyle='round', facecolor='wheat', alpha=0.5)
text = "Source: Some Official Data Source"
# Text box position can be adjusted
ax.text(0.05, -0.1, text, transform=ax.transAxes, fontsize=14,
verticalalignment='top', bbox=props)
# And you can adjust the space around the subplot to ensure the text box
# is shown if it is outside of the axes
plt.subplots_adjust(bottom=0.15)